Quick answer
For most researchers in 2026, the strongest free starting points are DefiLlama for DeFi protocol and TVL data and Dune Analytics for custom on-chain queries. Glassnode leads on Bitcoin and Ethereum macro cycle metrics, Nansen on smart money and wallet tracking, and Arkham on entity attribution. The strongest research stacks combine two or three complementary tools rather than relying on any single platform. Explore the free tiers directly at DefiLlama, Dune, and Glassnode.
The edge in crypto has always gone to the people with better information. In 2026, better information lives on-chain, and the tools that surface it have never been more powerful.
However, price charts only tell you what happened. On-chain analytics, by contrast, tell you why, and more importantly, what is likely to happen next. Whale wallet movements, smart money inflows, protocol revenue trends, governance participation rates, and funding rate dynamics are all visible to anyone willing to use the right tools. Yet most market participants are not using them. As a result, that gap becomes your opportunity.
This guide covers the best crypto analytics tools in 2026, what each one does, who it is best suited for, and where it fits in a serious research workflow. Whether you are a trader, a DeFi investor, a protocol team, or a researcher, there is a combination of tools on this list that will meaningfully improve the quality of your analysis.
Why Crypto Analytics Tools Matter More Than Ever in 2026
The crypto market in 2026 is more data-rich than it has ever been. Every transaction, every governance vote, every liquidity movement, and every protocol fee is recorded on-chain and publicly accessible. The challenge is not the availability of data. It is the ability to interpret it.
As institutional participation has grown, the information advantage has shifted from those who know the right people to those who can read the chain. In fact, smart money leaves footprints. Whale wallets, for example, cluster before major moves. Similarly, protocol revenue trends predict narrative shifts weeks before they hit mainstream feeds.
Ultimately, the analysts who consistently outperform in this environment are not smarter than everyone else. Instead, they are more systematic. They have built research workflows around tools that surface signal efficiently, and they use those tools consistently rather than reacting to price and headlines.
What to Look for in a Crypto Analytics Tool
Before committing to any platform, evaluate it against these criteria.
Data Accuracy and Coverage: The best tools source data directly from blockchain nodes rather than relying on third-party aggregators. Coverage across multiple chains matters increasingly as the ecosystem fragments. A tool that only covers Ethereum is significantly less useful in 2026 than one that covers Ethereum, Solana, Arbitrum, Base, and the other major ecosystems.
Depth vs Accessibility: This is a real trade-off. Some tools are built for power users who write SQL queries. Others are built for traders who need fast visual dashboards. The right tool depends on your workflow. Building a stack that includes both a flexible query platform and a pre-built dashboard tool is usually more effective than trying to find one platform that does everything adequately.
Freshness of Data: On-chain data delays are a meaningful limitation for time-sensitive decisions. Notably, the best platforms offer near-real-time data updates. Others, however, have delays of minutes or hours. For long-term research, the delay matters less. For active trading, it matters considerably.
Cost and Free Tier Quality: Several of the best tools offer genuinely useful free tiers alongside paid plans. Understanding exactly what is and is not accessible without payment helps you build an efficient research stack without paying for overlapping capabilities.
Institutional vs Retail Orientation: Some platforms are built primarily for institutional desks and carry pricing that reflects that. Others are accessible to individual traders and researchers. Matching the platform to your scale and use case avoids paying for capabilities you will never use.
Best Crypto Analytics Tools in 2026 At a Glance
| Tool | Best For | Primary Focus | Free or Paid |
|---|---|---|---|
| Glassnode | Bitcoin and Ethereum macro analysis | On-chain market health metrics | Limited free, paid plans |
| Dune Analytics | Custom on-chain queries and dashboards | Community-built SQL analytics | Free + paid |
| Nansen | Smart money tracking and wallet labeling | Wallet analytics, token flows | Paid, limited free |
| Token Terminal | Protocol fundamentals and revenue | Financial metrics for blockchains and dApps | Free + paid |
| DefiLlama | DeFi protocol TVL and ecosystem data | Multi-chain DeFi analytics | Free |
| Messari | Research, governance, sector analysis | Crypto intelligence and governance | Free + paid |
| Arkham Intelligence | Wallet deanonymization and entity tracking | Blockchain entity analytics | Free + paid |
| Santiment | Social sentiment and behavioral analytics | On-chain + social + development data | Free + paid |
| Sentora | Institutional DeFi risk and analytics | DeFi risk management and monitoring | Institutional |
Best Crypto Analytics Tools (Full Breakdown)
Glassnode
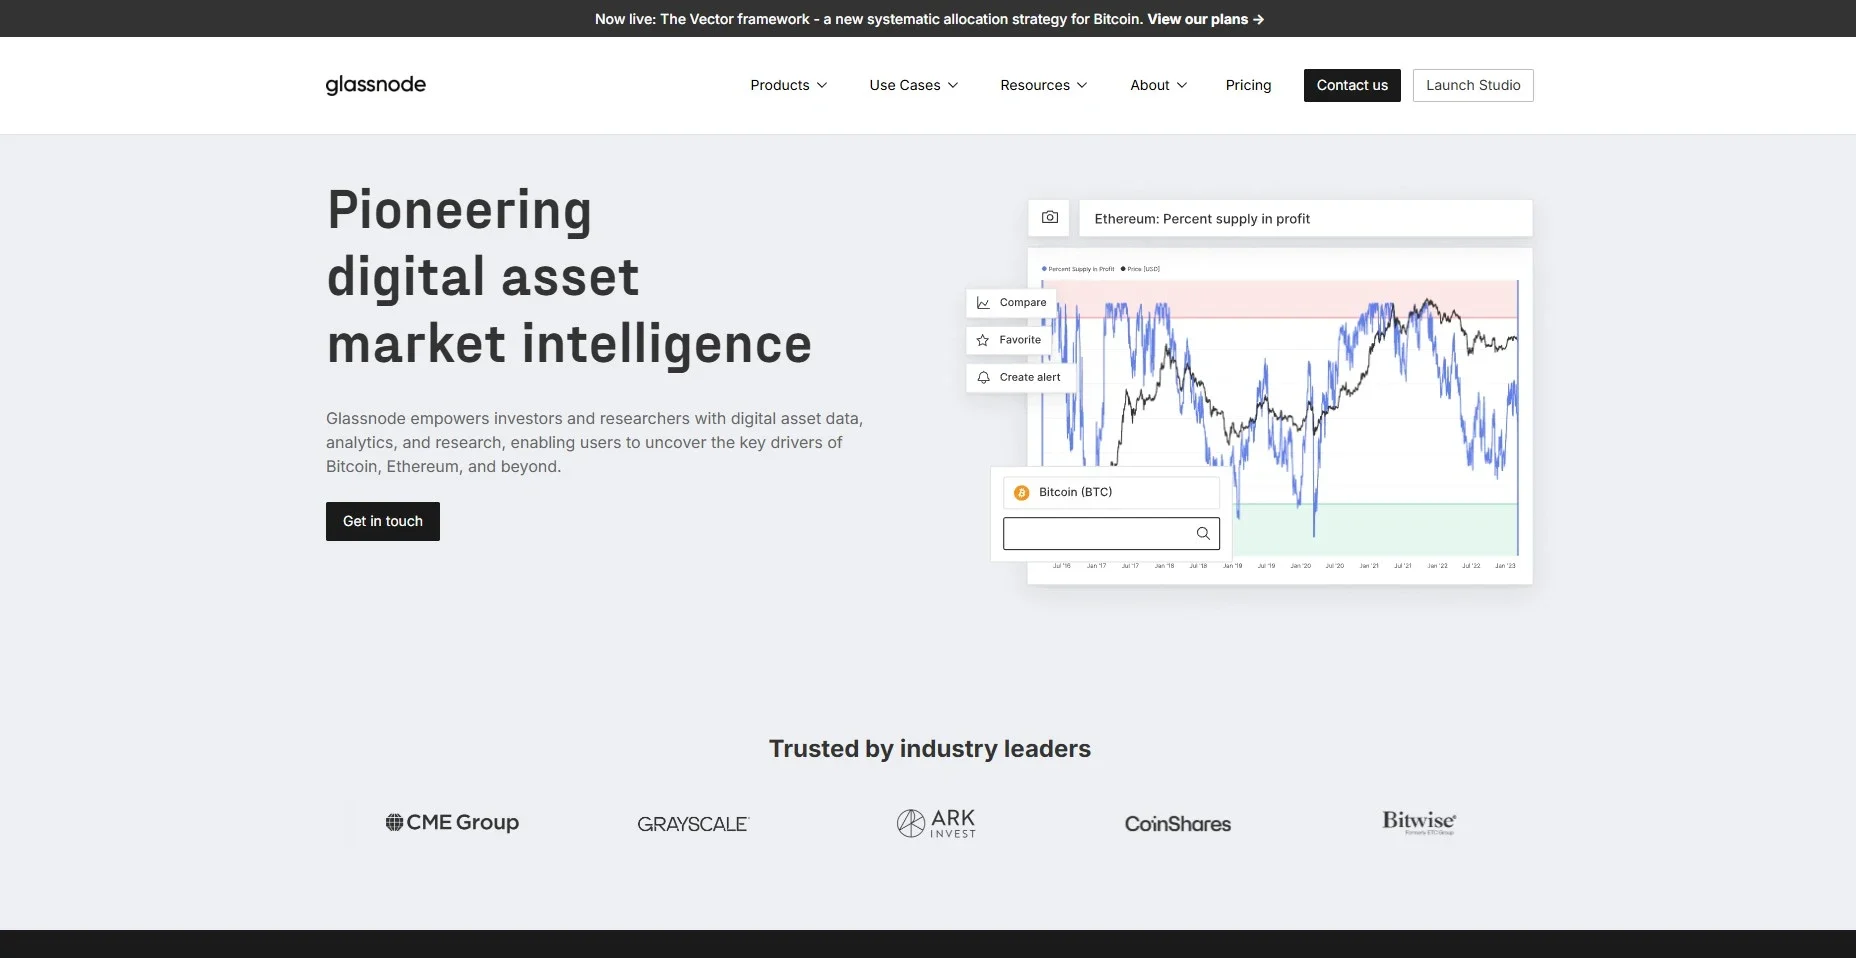
Glassnode is the gold standard for Bitcoin and Ethereum on-chain analytics and remains one of the most-cited data sources among serious market participants and institutional researchers. The platform is built around proprietary metrics that track market cycles, investor behavior, and network health with a rigor that most on-chain platforms do not attempt to match.
The signature Glassnode metrics include MVRV Z-Score, SOPR, Realized Price, and the NUPL indicator. These have become standard reference points for analysts trying to identify macro market turning points. Additionally, the data underlying these indicators is sourced directly from the blockchain and updated in near-real-time. It is also presented with enough historical context to identify meaningful patterns across multiple cycles.
The Glassnode weekly research newsletter is one of the more useful free resources the platform offers, synthesizing on-chain conditions into readable analysis that does not require deep technical knowledge to follow. The paid Studio subscription unlocks the full data library, custom charting, and advanced cohort analysis.
Best for: Macro analysts, long-term investors, and institutional researchers focused on Bitcoin and Ethereum market cycle analysis
Primary focus: On-chain market health, investor behavior, cycle indicators
Free or paid: Limited free data, paid plans for full access
Standout feature: Proprietary market cycle metrics with long historical datasets that no other platform matches on Bitcoin specifically
Dune Analytics
Dune Analytics is the most flexible analytics platform in crypto, giving anyone with SQL knowledge the ability to query raw blockchain data and build custom dashboards covering any protocol, any wallet, or any on-chain interaction across more than one hundred blockchains.
The community dimension of Dune is one of its greatest strengths. The best analysts in crypto publish their Dune dashboards publicly. Browsing the most popular dashboards for a specific protocol or sector is one of the fastest ways to surface on-chain intelligence. When a new protocol launches, an exploit occurs, or a governance proposal passes, Dune dashboards tracking the activity appear within hours. The same on-chain analysts who were already watching the space often build them.
Meanwhile, the paid tiers unlock faster query execution, private dashboards, and API access that serious researchers need. The free tier, however, remains genuinely useful for exploration, analysis of existing dashboards, and queries that are not time-sensitive.
Best for: Researchers, analysts, and developers who want maximum flexibility to build custom on-chain analytics across any protocol or chain.
Primary focus: Custom SQL queries, community analytics, multi-chain data
Free or paid: Free tier with limitations, paid plans for speed and API access
Standout feature: The community dashboard library is arguably the richest public on-chain intelligence resource in the industry.
Nansen
Nansen built its reputation on smart money tracking and has continued to expand that capability into one of the most comprehensive on-chain intelligence platforms available in 2026. The core product is wallet labeling. The platform has labeled over 500 million addresses across multiple chains, identifying entities from exchanges and protocols to specific VC firms and known market participants.
Following smart money on Nansen means watching wallets that have historically made profitable early moves. You can track what they are accumulating, rotating into, or exiting. The Signal product surfaces these movements in real time, which gives active traders a meaningful information edge on narrative and rotation dynamics.
Beyond that, Nansen has evolved significantly past its original wallet-labeling focus. For instance, the AI copilot and research tools added in recent years allow users to query on-chain data in natural language. This surfaces insights that previously required SQL knowledge to access.
Best for: Active traders who want real-time smart money tracking, and researchers who need wallet-level on-chain intelligence across multiple chains
Primary focus: Wallet analytics, smart money flows, token analytics
Free or paid: Primarily paid, with limited free exploration tools
Standout feature: The depth and quality of wallet labeling across 500 million addresses is unmatched in the industry.
Token Terminal
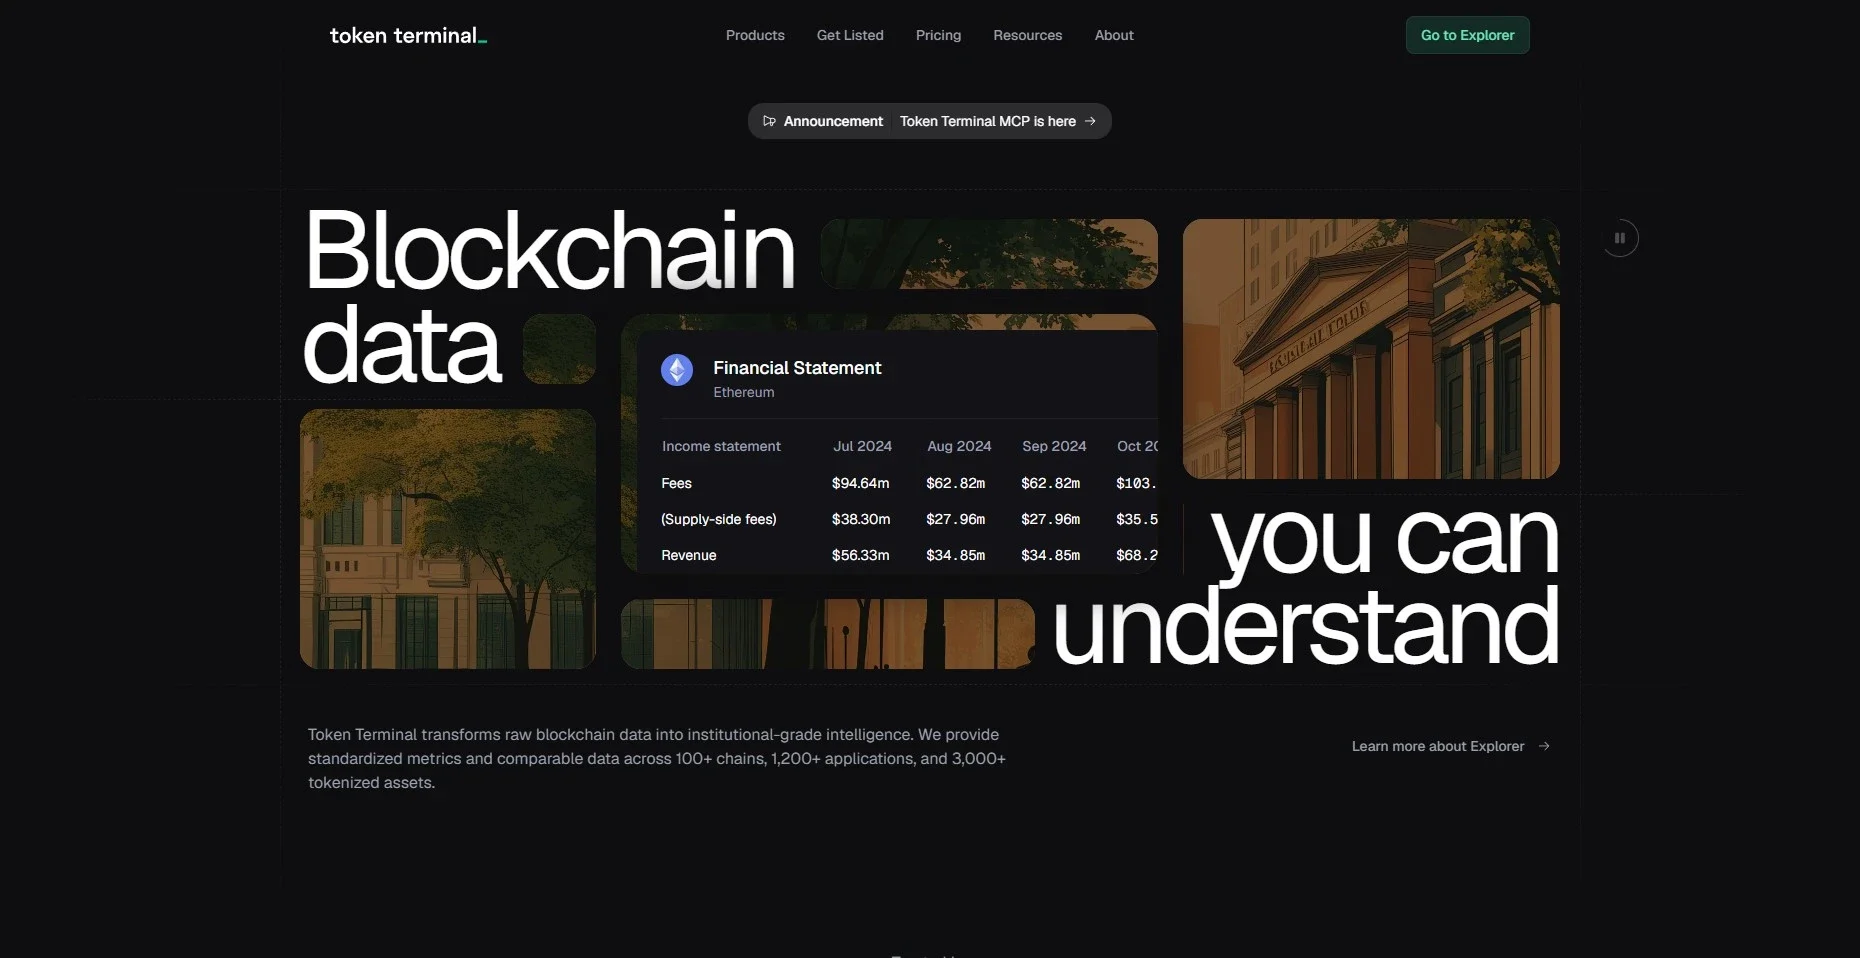
Token Terminal applies traditional financial analysis frameworks to crypto protocols, making it the most useful tool for investors who think about blockchain projects in terms of revenue, earnings, price-to-sales ratios, and other fundamental valuation metrics.
The platform tracks fee revenue, protocol revenue, active users, and TVL across hundreds of blockchains and dApps. It presents the data in the standardized format that institutional investors and analysts are accustomed to working with. The protocol comparison tools make it easy to benchmark one protocol against its sector peers on financial fundamentals rather than purely on token price performance.
Furthermore, Token Terminal’s sector dashboards cover DeFi, L1 and L2 infrastructure, NFT markets, and derivatives. As a result, they are among the most useful reference tools for tracking where real economic activity is concentrated at any given moment.
Best for: Investors and analysts who want fundamental financial metrics on blockchain protocols and want to apply traditional finance valuation frameworks to crypto
Primary focus: Protocol revenue, fees, user growth, financial fundamentals
Free or paid: Free core metrics, paid plan for full data access and API
Standout feature: The ability to compare protocols on standardized financial metrics across sectors is uniquely useful for fundamental crypto research.
DefiLlama
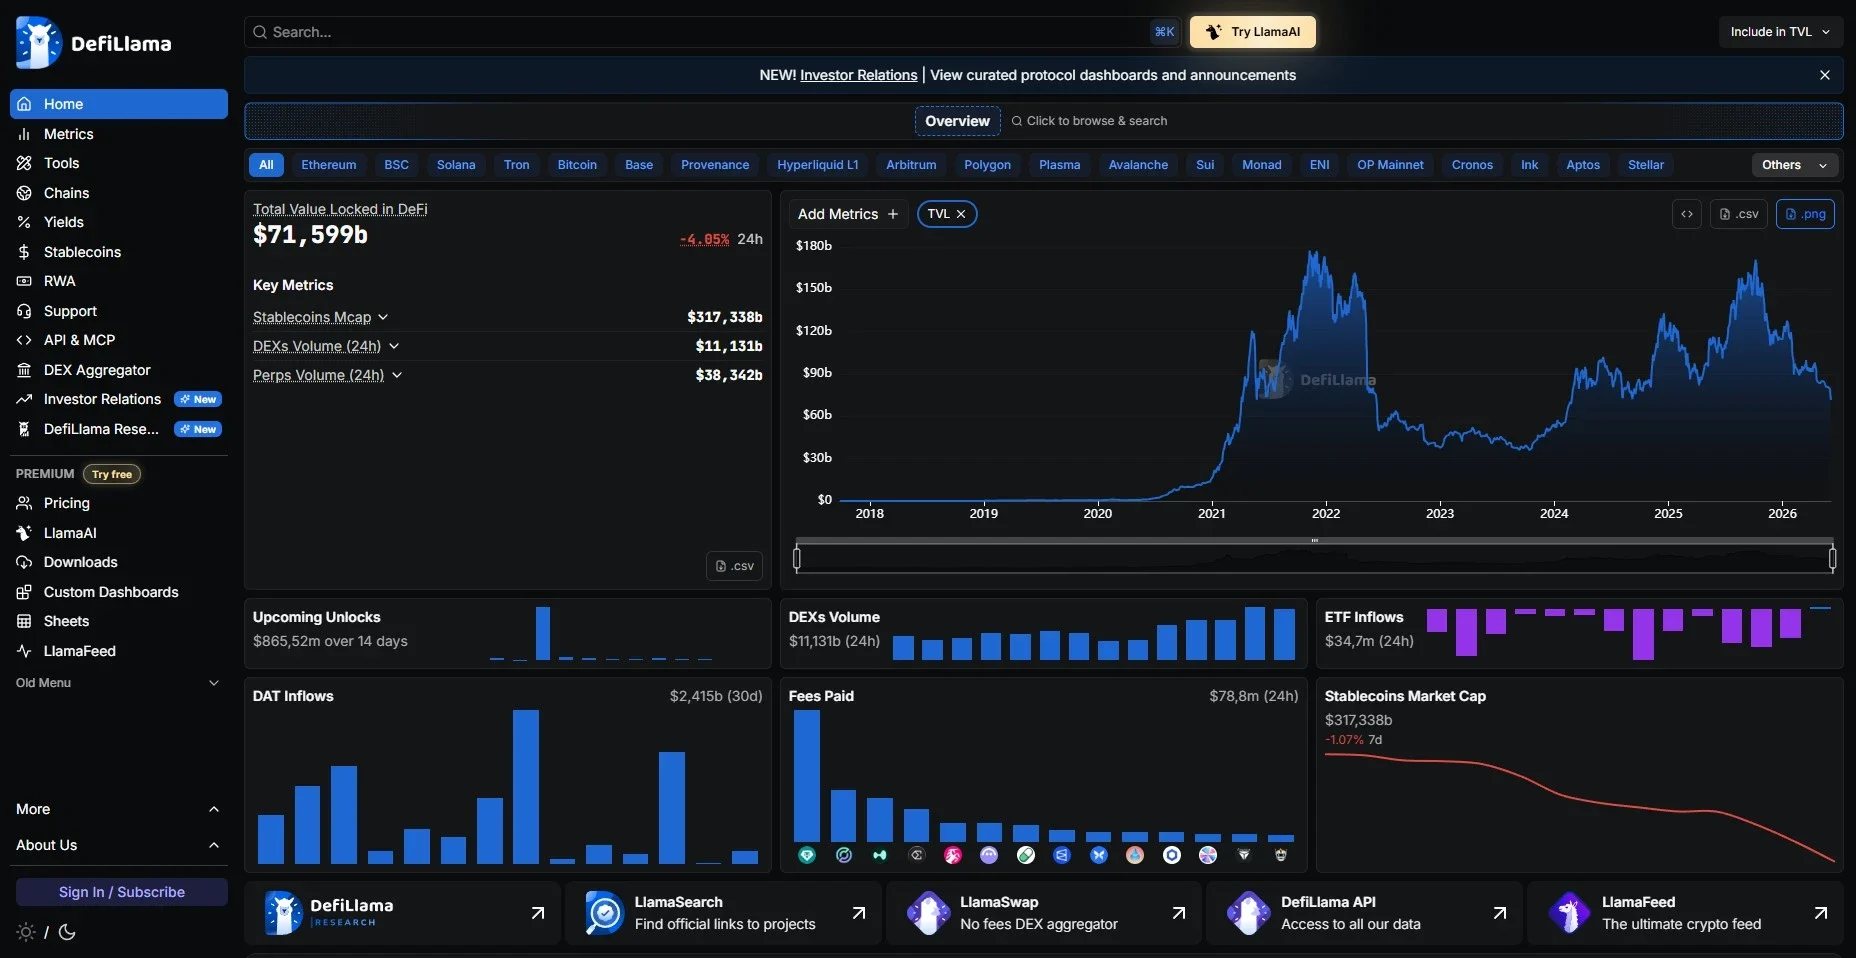
DefiLlama is the most widely used free DeFi analytics tool in the world, tracking total value locked, protocol revenue, fees, yields, and DEX volumes across more than seven thousand protocols on more than five hundred chains. It is open-source, free, and ad-free, which makes it an unusually trustworthy reference for the data it covers.
The TVL dashboards are the core product, but DefiLlama has expanded significantly into yield tracking, stablecoin analytics, DEX volume data, token unlock schedules, and protocol revenue metrics. For anyone trying to understand the relative scale and health of DeFi protocols across the ecosystem, DefiLlama is the fastest and most comprehensive starting point available.
In addition, the DL News integration brought editorial journalism alongside the data platform. This adds a useful contextual layer for readers who want to understand not just what the numbers show, but why they are moving.
Best for: Anyone who needs a free, comprehensive, and trustworthy reference for DeFi protocol data across chains
Primary focus: TVL, protocol revenue, yield tracking, multi-chain DeFi analytics
Free or paid: Completely free
Standout feature: Breadth of protocol and chain coverage, combined with the fact that it is genuinely free and open-source, makes it uniquely useful as a daily reference.
Messari
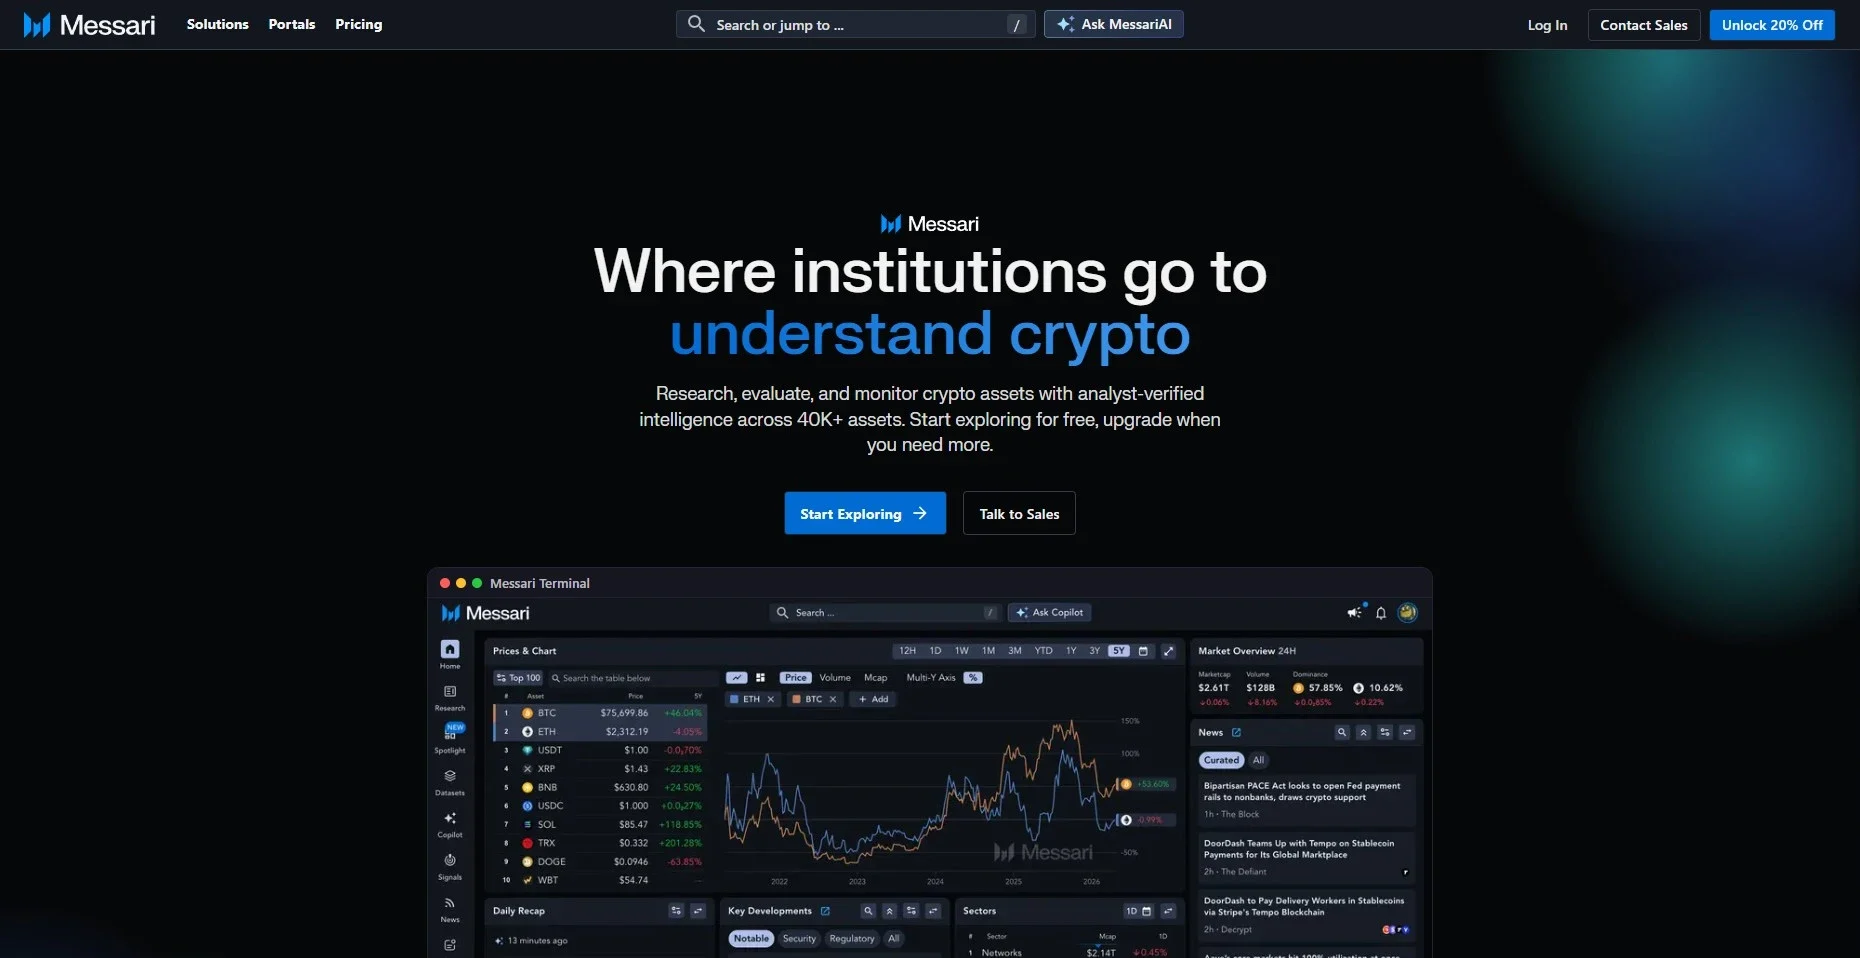
Messari sits at the intersection of analytics and research, offering a platform that combines market data, token profiles, governance tracking, and institutional-grade research reports in a single subscription. The platform is particularly strong for governance analysis, tracking on-chain proposals across dozens of protocols and providing context on what each vote means for the relevant ecosystem.
The Messari Research reports, which cover individual protocols, sector trends, and macro crypto dynamics with academic-level rigor, are the platform’s clearest differentiator. The annual Crypto Theses report has become one of the most referenced documents in the industry, providing a comprehensive framework for understanding the year ahead across every major vertical.
Notably, the free tier provides meaningful access to market data and basic protocol profiles. Meanwhile, the Pro subscription unlocks the full research library, advanced screeners, and API access that institutional teams rely on.
Best for: Institutional investors, protocol teams, researchers, and anyone who needs to combine market data with rigorous research in a single platform
Primary focus: Research reports, governance tracking, token analytics, sector analysis
Free or paid: Free data tier, paid research subscription
Standout feature: Governance tracking depth and research report quality that bridges journalism and institutional financial analysis
Arkham Intelligence
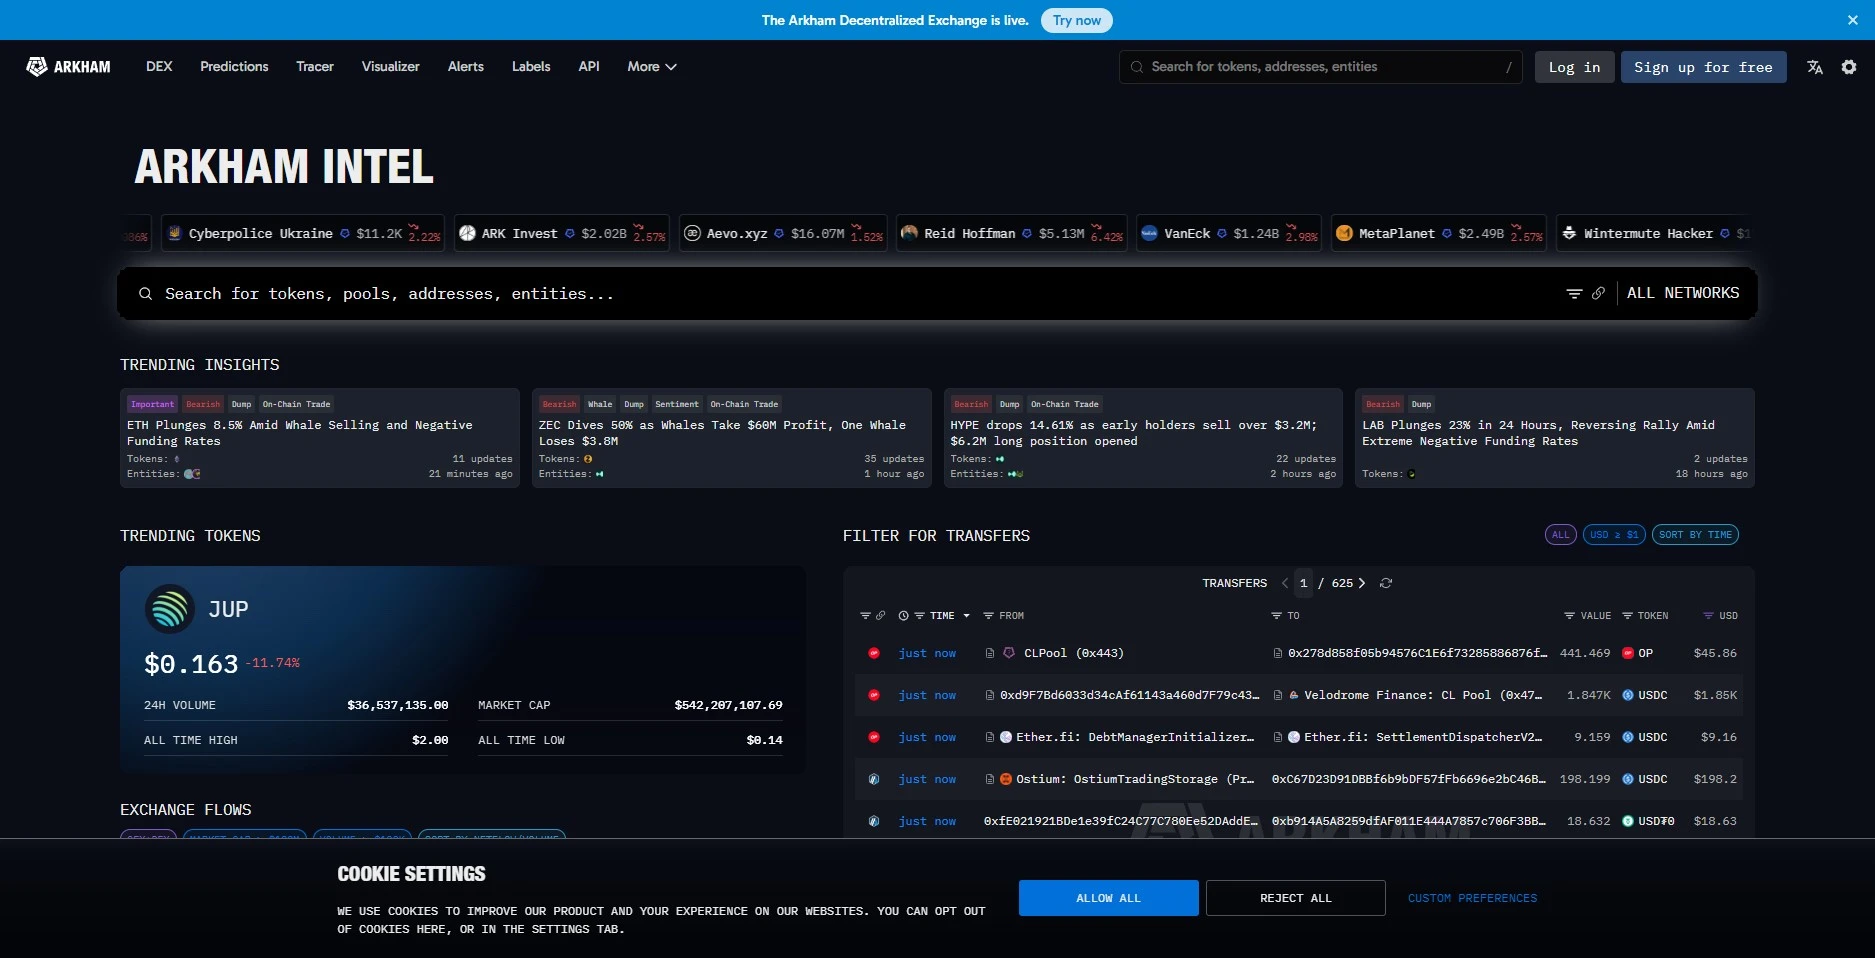
Arkham Intelligence introduced a category that did not previously exist in crypto: systematic blockchain entity deanonymization at scale. The platform builds a continuously updated database of real-world identities, institutions, and named individuals matched to specific on-chain wallet addresses, allowing analysts to track the financial activity of known entities across blockchains.
The Intel platform allows users to search for wallets, visualize transaction graphs between entities, set up alerts for specific wallet activity, and browse the Arkham exchange for intelligence bounties, where users can earn rewards for identifying the real-world owners of specific addresses.
Arkham serves compliance teams, investigative researchers, and sophisticated traders who want to understand the entity-level activity behind large on-chain movements. It provides a level of attribution capability that was previously only available to blockchain forensics firms working at an institutional scale. The attribution database now spans roughly 3.5 billion address labels and 800,000 verified entities built up since 2022, one of the deepest identity datasets in the industry.
More recently, Arkham has continued to expand the scope of what its deanonymization engine covers. In May 2026 it launched a dedicated analytics suite for on-chain prediction markets. Users can rank top traders by profit and loss, inspect open positions, and study win rates with the same attribution layer built for whale tracking. It also shipped API documentation that connects AI models directly to its live on-chain intelligence, which makes Arkham increasingly useful as a programmatic data source rather than only a dashboard.
Best for: Researchers, compliance professionals, and traders who need entity-level on-chain attribution and want to track the activity of known institutions and individuals.
Primary focus: Wallet deanonymization, entity tracking, transaction graph analysis
Free or paid: Free exploration, paid professional plans
Standout feature: The Intel exchange model, where community contributors earn rewards for entity identification, has built a continuously improving attribution database.
Santiment
Santiment is unique among analytics platforms in combining on-chain data with social sentiment analysis and developer activity metrics, giving users a three-dimensional view of crypto market dynamics that purely on-chain tools miss.
The social data coverage tracks mentions, sentiment, and discussion volume across CT, Reddit, Telegram, and Discord. This helps analysts identify when narratives are forming before they reflect in price. The development activity metrics track GitHub commits across protocol repositories, providing a signal on which projects are actually building versus those that are purely marketing-driven. The on-chain data layer covers wallet holder behavior, exchange flows, and token distribution metrics across a broad range of assets.
The combination of these three data streams makes Santiment particularly useful for analysts who want a complete picture of conviction and momentum. It surfaces both before they become obvious to the rest of the market.
Best for: Analysts who want to combine on-chain signals with social sentiment and development activity to identify early-stage narrative formation and momentum shifts
Primary focus: On-chain data, social sentiment, developer activity
Free or paid: Free limited tier, paid plans for full historical data and alerts
Standout feature: The three-signal combination of on-chain, social, and development data in one platform is genuinely differentiated.
Sentora (formerly IntoTheBlock)
Sentora is the result of IntoTheBlock merging with Trident Digital to create a new institutional DeFi analytics and risk management platform. The relaunch reflects a significant evolution from the retail-oriented analytics tool IntoTheBlock originally built toward an institutional-grade product that combines DeFi risk intelligence with yield optimization tools.
The platform is now positioned as the institutional DeFi layer. It offers real-time risk monitoring, yield strategy analysis, and capital allocation intelligence for professional investors and DeFi treasury managers. The on-chain analytics that IntoTheBlock was known for carry through into the new platform. These include wallet holder distribution analysis, concentration metrics, and DeFi protocol intelligence, now with significantly enhanced institutional tooling.
For institutional participants managing significant DeFi exposure, Sentora fills a gap that consumer analytics tools are not designed for: systematic risk monitoring at portfolio scale across multiple protocols and chains.
Best for: Institutional investors, DeFi treasury managers, and professional analysts who need enterprise-grade risk monitoring and capital allocation intelligence for DeFi exposure
Primary focus: Institutional DeFi risk management, yield analytics, portfolio intelligence
Free or paid: Institutional pricing
Standout feature: The institutional risk management layer built on top of deep on-chain analytics addresses a gap that consumer platforms are not designed to fill.
How to Build Your Crypto Analytics Stack
No single tool covers everything you need. The strongest research workflows combine two or three complementary platforms rather than trying to find one that does everything.
A solid baseline stack for most serious participants looks like this. Start with DefiLlama as your free, always-on reference for protocol TVL, revenue, and yield data. It requires no subscription and covers more protocols than any paid alternative. Add Glassnode for macro Bitcoin and Ethereum cycle analysis, using the free weekly newsletter as a minimum and the paid Studio for deeper research. Layer Dune Analytics on top for custom queries and access to the community dashboard library. This gives you the fastest path to on-chain intelligence on any specific protocol or event.
For traders who need smart money tracking, Nansen adds wallet-level signal that the other tools do not provide. For fundamental investors, Token Terminal adds the financial metrics framework that Glassnode and Dune do not prioritize.
Arkham and Santiment fill specific niches that the core stack does not cover: entity attribution and social sentiment respectively. Both are worth adding if those dimensions are relevant to your strategy.
The key principle is to use each tool for what it is actually best at rather than trying to force one platform to do everything.
Final Thoughts
The best crypto analytics tools in 2026 are the difference between reacting to price movements and understanding what is driving them. They are the infrastructure of informed decision-making in a market that punishes guesswork and rewards systematic research.
Building a well-chosen analytics stack takes an afternoon and pays dividends indefinitely. Start with the free tools, identify what gaps your research process still has, and add paid capabilities only where the return on that investment is clear.
In crypto, the data is all on-chain. The advantage goes to whoever reads it best.
Work With Cryptic
If you are a Web3 protocol or crypto brand that needs content built on real research, Cryptic produces SEO-driven articles, guides, and strategies that bring qualified traffic to your project.
Visit crypticweb3.com to see how we work.
Frequently Asked Questions
What are the best free crypto analytics tools in 2026?
DefiLlama is the strongest free option for DeFi protocol data and TVL tracking across chains. Dune Analytics offers a meaningful free tier for custom on-chain queries. Glassnode publishes a free weekly on-chain newsletter. Messari offers a useful free data tier. For wallet entity analysis, Arkham Intelligence provides free exploration tools.
What is on-chain analytics?
On-chain analytics is the practice of analyzing data recorded directly on blockchain networks, including transaction histories, wallet balances, smart contract interactions, and token flows. Unlike price charts, on-chain data reveals the actual behavior of market participants rather than just the outcome of that behavior in price terms.
Which crypto analytics tool is best for tracking whale activity?
Nansen is the strongest tool for smart money and whale wallet tracking, with over 500 million labeled wallet addresses across multiple chains. Arkham Intelligence adds entity attribution, allowing you to identify the real-world identities behind specific large wallets. Both complement each other for comprehensive whale activity analysis.
What is the difference between Glassnode and Nansen?
Glassnode focuses primarily on aggregate Bitcoin and Ethereum market health metrics, macro cycle indicators, and investor cohort analysis. Nansen focuses on individual wallet tracking, smart money flows, and token-level analytics. Glassnode is better for macro cycle analysis; Nansen is better for tracking specific entities and capital rotation in real time.
Is DefiLlama reliable?
Yes. DefiLlama is open-source, ad-free, and one of the most widely trusted DeFi data references in the industry. Its TVL methodology is transparent and publicly documented. For DeFi protocol comparison and ecosystem-level data, it is among the most reliable free resources available.
What happened to IntoTheBlock?
IntoTheBlock merged with Trident Digital and relaunched as Sentora in 2025, repositioning from a retail-oriented analytics platform to an institutional DeFi risk management and analytics solution. The new platform is aimed at professional investors and treasury managers rather than individual retail participants.
How do I get started with Dune Analytics?
Create a free account at dune.com, browse the trending dashboards to get a sense of what the community has built, and search for dashboards covering protocols or sectors you are researching. If you want to build your own queries, Dune’s documentation provides a good starting point for learning the SQL syntax required to query blockchain data directly.