Quick answer
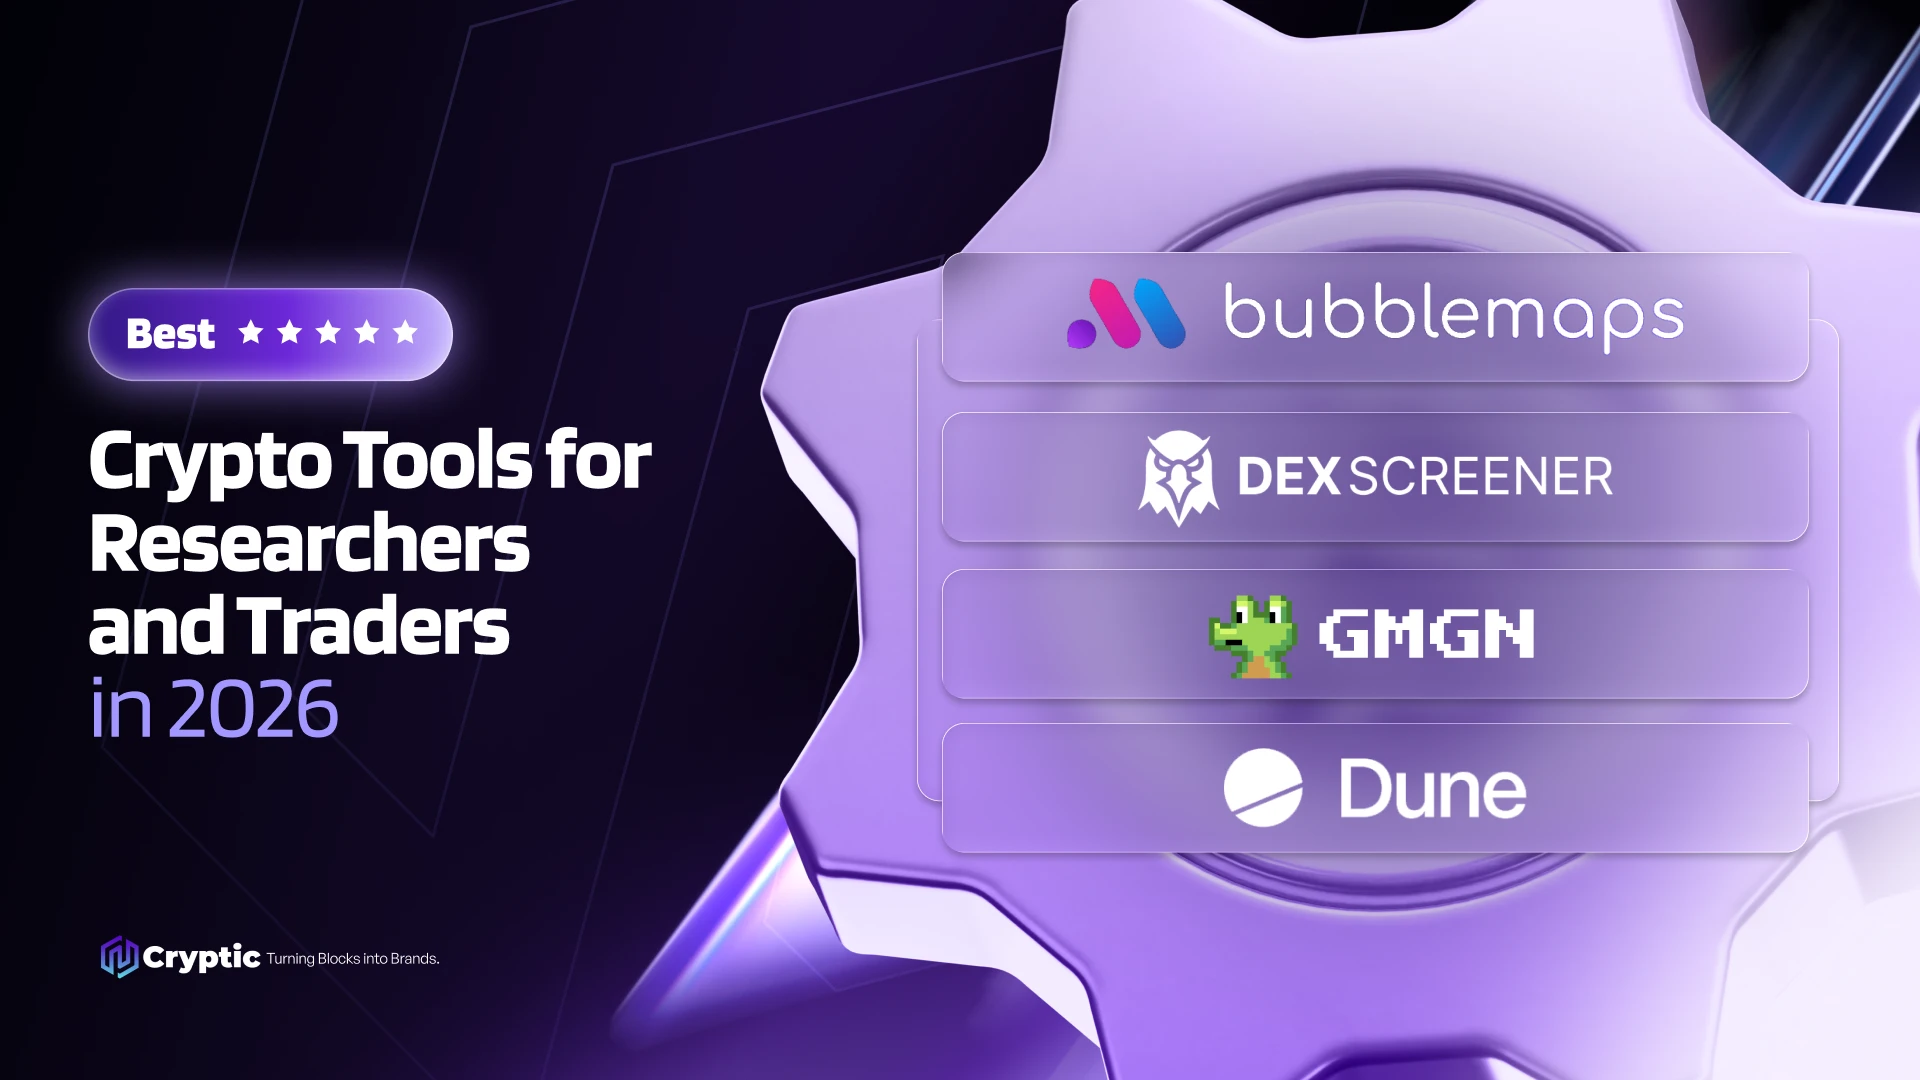
On-chain analytics tools turn raw blockchain data into clear answers about who holds a token and how it trades. The best options in 2026 are Bubblemaps for wallet clustering and token holder analysis, DEXScreener for real-time DEX market data, GMGN for fast trading and smart wallet discovery, and Dune for custom on-chain queries. Most researchers and traders combine them, starting with Bubblemaps to check who really controls a token’s supply.
Every token launch tells a story on the blockchain. The problem is that most of it is hidden in thousands of wallet addresses and transactions that look identical to the untrained eye. That is why on-chain analytics has become the foundation of serious crypto research and trading. Whether you are vetting a new token, hunting for early signals, or investigating a suspicious price move, the right tools turn raw blockchain data into decisions.
This guide covers the best tools for researchers and traders today, what each one does best, and how to combine them into a workflow that works for you.
Why On-Chain Analytics Matters
The blockchain is public, but public does not mean readable. A single entity can control dozens of wallets, spread supply across fresh addresses, and make a token look far more decentralized than it really is. Blockchain analytics closes that gap by letting you see who holds what, where funds came from, and how wallets relate to each other.
For traders, this means avoiding rug pulls, insider-controlled supply, and coordinated dumps. For researchers, it means verifying claims with data instead of trusting a project’s own marketing.
The core techniques worth mastering are:
- Token holder analysis: understanding how supply is distributed and who the real top holders are.
- Wallet clustering: grouping addresses that are likely controlled by the same entity.
- Wallet tracking: following the moves of known wallets in real time.
- Custom queries: pulling exactly the data you need when no dashboard exists for it.
No single tool does all of this equally well. Here is how the best options compare.
1. Bubblemaps on-chain analytics: Best for Wallet clustering and Token Holder Analysis
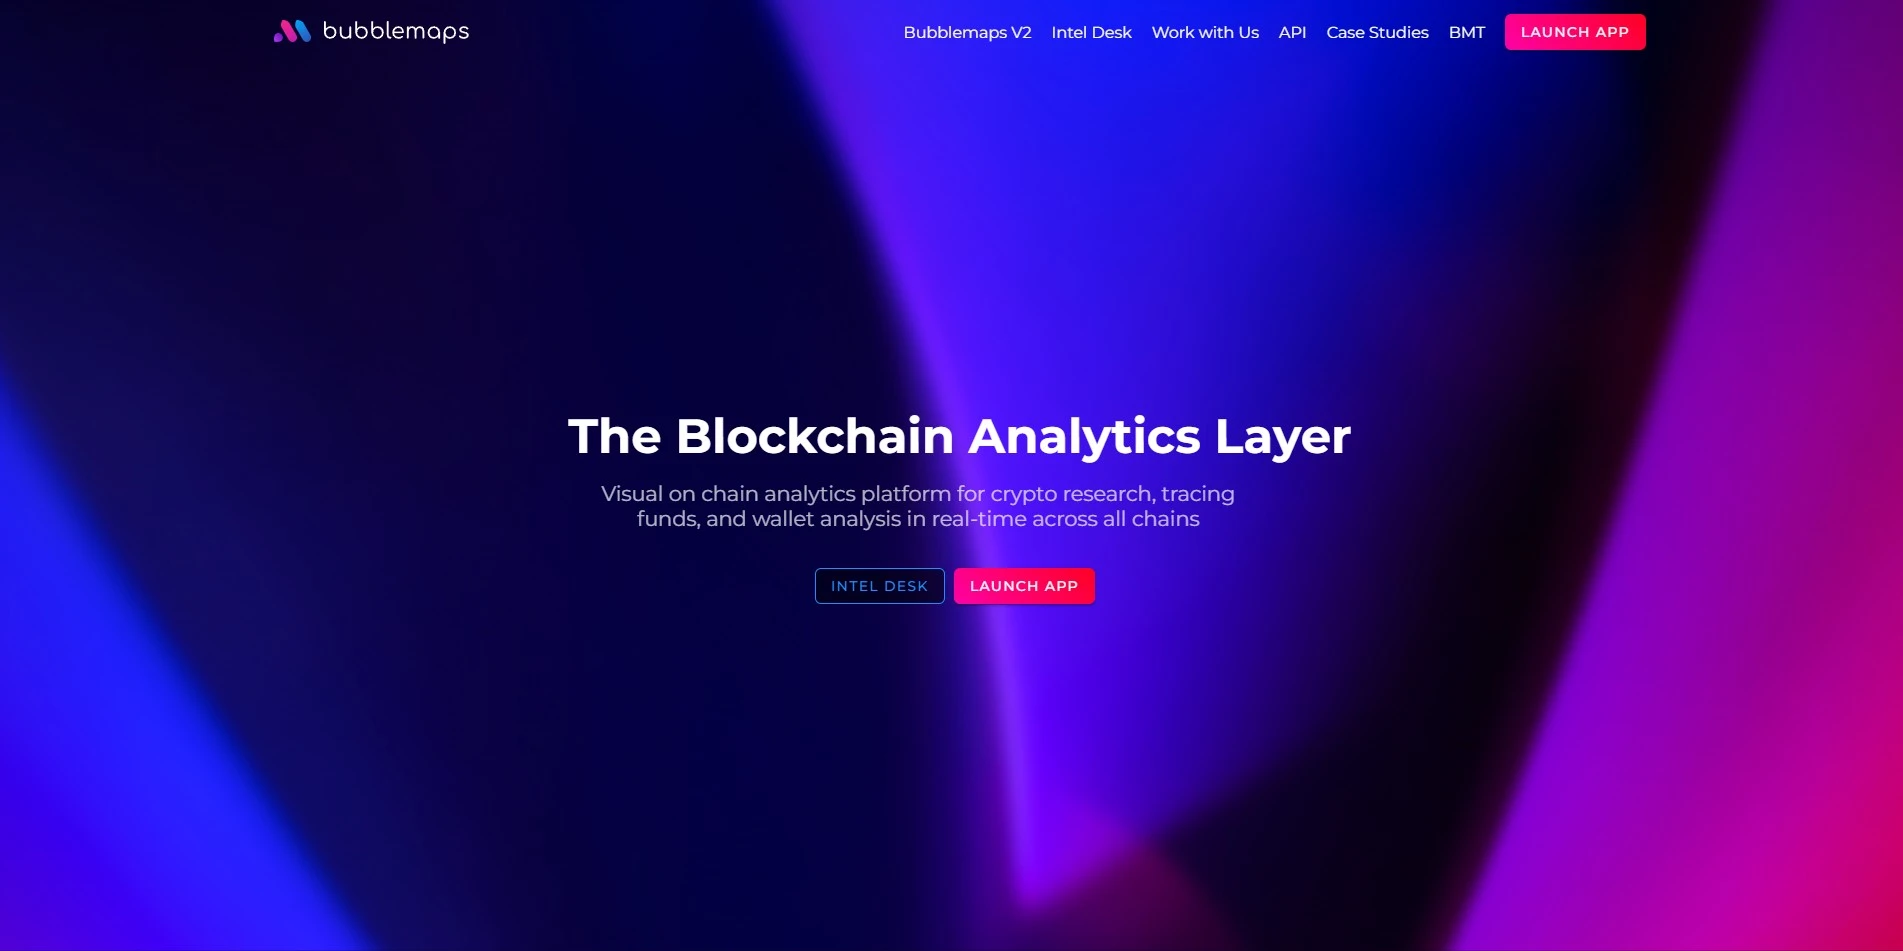
Bubblemaps is a blockchain analytics platform built around one simple idea: if you can see the relationships between wallets, you can understand a token in seconds. Instead of a long table of addresses, Bubblemaps displays holders as bubbles. The size of each bubble reflects the amount of supply held, and the links between bubbles show transfers between wallets.
That visual approach makes patterns obvious that a spreadsheet would hide. A cluster of connected bubbles holding a large share of supply is a red flag. A healthy, widely distributed token looks completely different.
What makes Bubblemaps stand out:
- Wallet clustering at a glance. Connected wallets are grouped visually, so you can quickly spot supply controlled by a single entity or coordinated group, even when it is split across many addresses.
- Deep token holder analysis. See the real concentration of a token rather than the misleading top-holder list on a basic explorer.
- Multi-chain coverage. Analyze tokens across major networks from one interface.
- Time-based exploration. Look at how holder structure and connections evolved, which helps you understand what happened around a launch or a price move.
- Data API. Developers, funds, and platforms can integrate Bubblemaps data directly into their own products and research pipelines.
If your question is “who really controls this token?”, Bubblemaps is the fastest way to get an answer. It is the tool most researchers open first when vetting a project, and the one traders reach for before they size a position.
Best for: on chain analytics, token holder analysis, detecting insider-controlled supply, wallet clustering, pre-trade due diligence.
2. DEXScreener: Best for Real-Time DEX Market Data
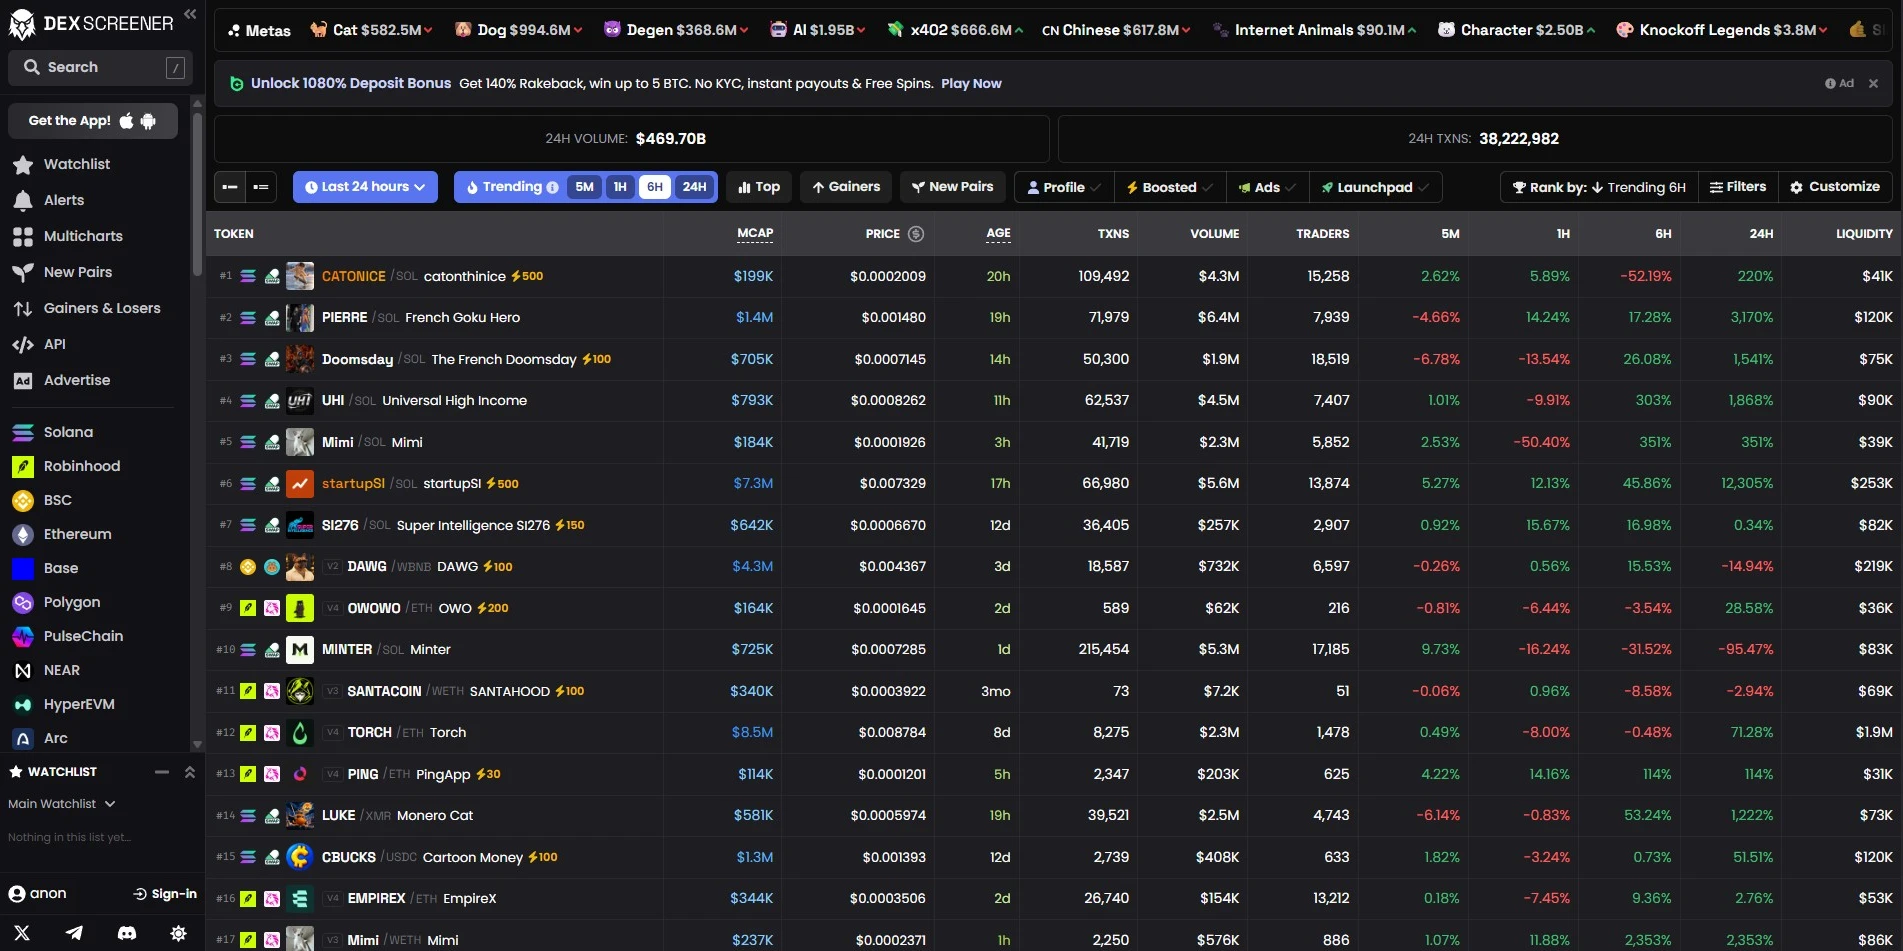
DEXScreener is the go-to dashboard for decentralized exchange markets. It tracks pairs across many chains and DEXs, giving you live charts, liquidity, volume, and recent trades in a clean interface.
Where Bubblemaps tells you who holds a token, DEXScreener tells you how it is trading. Its trending lists and new pair feeds make it a favorite for spotting momentum early, and its liquidity and volume data help you judge whether a market is deep enough to trade safely.
Best for: live price action, new pair discovery, liquidity and volume checks across chains.
Pro tip: Use DEXScreener to find a token that is moving, then open it in Bubblemaps to check whether the supply behind that move is genuinely distributed.
3. GMGN: Best for Fast Trading and Smart Wallet Discovery
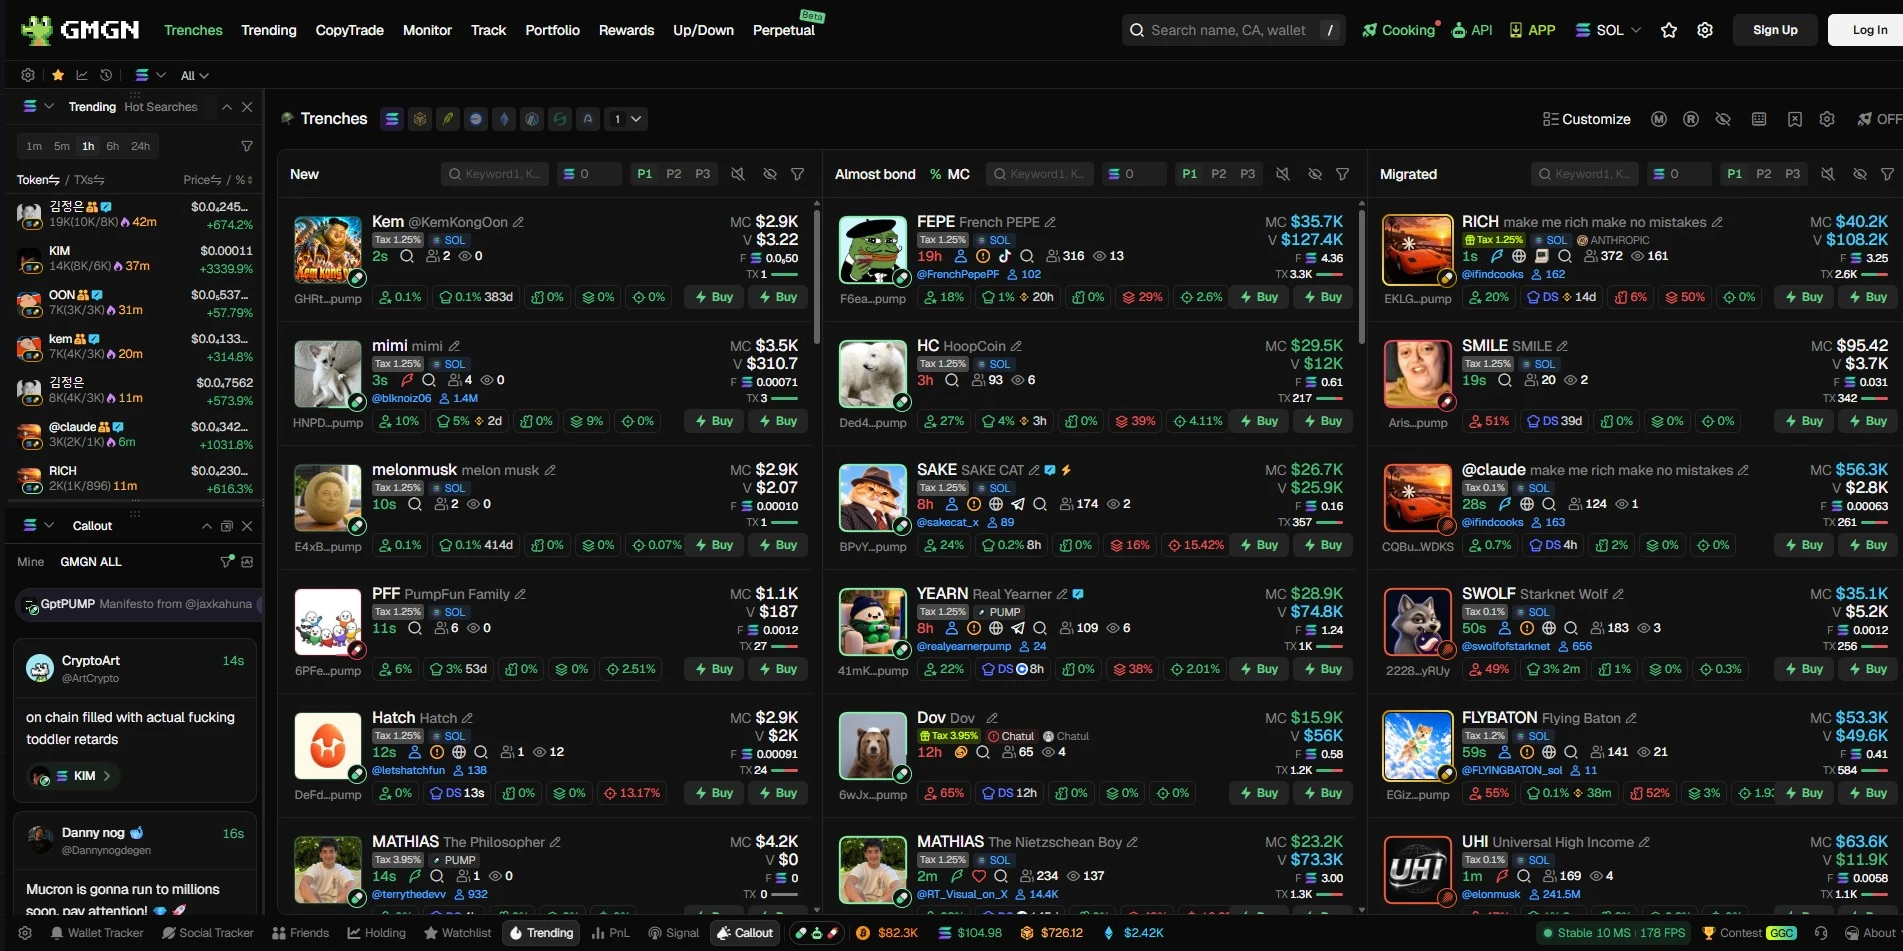
GMGN is a trading-focused platform that pairs market data with wallet-level insights. It is especially popular among active traders on fast-moving ecosystems, thanks to its tools for spotting profitable wallets and acting on opportunities quickly.
For anyone who wants to track wallets on chain, GMGN makes it easy to see what high-performing traders are buying and selling. That kind of signal is useful for idea generation, but it works best when you verify it. A wallet being active in a token is not proof the token is safe.
Best for: active trading, following successful wallets, discovering new tokens quickly.
Pro tip: Treat wallet activity on GMGN as a lead, then confirm the token’s holder structure with Bubblemaps before committing capital.
4. Dune: Best for Custom On-Chain Queries and Dashboards
Dune is the most flexible tool on this list. It lets you query blockchain data with SQL and build your own dashboards, or explore thousands of dashboards created by the community.
If you have a research question that no off-the-shelf tool answers, such as measuring protocol growth, comparing user activity across chains, or analyzing a specific contract, Dune is where you build the answer. The tradeoff is a learning curve: you need to be comfortable with SQL to get the most out of it.
Best for: custom research, protocol and ecosystem metrics, building shareable onchain analytics dashboards.
Quick Comparison
| Tool | Best for | Skill level | Main strength |
|---|---|---|---|
| Bubblemaps | Wallet clustering, on chain analysis, track wallets on chain | Beginner to advanced | Visual map of who controls token supply |
| DEXScreener | Live DEX market data | Beginner | Charts, liquidity, new pairs |
| GMGN | Fast trading, wallet discovery | Intermediate | Following smart wallets |
| Dune | Custom queries and dashboards | Advanced | Flexible SQL-based research |
How to Combine These Tools Into a Workflow
The best researchers and traders do not rely on one tool. They stack them, each covering the others’ blind spots. A simple workflow looks like this:
- Discover. Use DEXScreener or GMGN to find tokens with unusual volume, momentum, or smart wallet activity.
- Verify the holders. Open the token in Bubblemaps. Check for clusters of connected wallets, concentrated supply, and signs of insider control. This single step filters out a large share of risky tokens.
- Investigate the wallets. Follow interesting addresses to understand their history and behavior, and track wallets you want to monitor.
- Go deeper when needed. Use Dune to build custom queries when you need broader context, such as ecosystem-wide trends or contract-level data.
- Decide with data. Combine the market view, the holder view, and the wallet view before you commit.
Notice where the most important question gets answered: step two. Price action can be manipulated and hype can be manufactured, but supply distribution is much harder to fake once you can see it clearly. That is exactly why Bubblemaps sits at the center of this workflow.
What to Look for in an On-Chain Analytics Tool
When choosing your stack, keep these criteria in mind:
- Clarity. Can you understand what you are seeing quickly, or does the data require a lot of interpretation?
- Coverage. Does the tool support the chains you actually trade or research?
- Depth. Does it go beyond surface-level holder lists to reveal relationships between wallets?
- Speed. In fast markets, a tool that takes minutes to answer a question is a tool you will not use.
- Flexibility. Can you export, integrate, or build on top of the data when your needs grow?
Final Thoughts
On-chain data gives researchers and traders an edge that did not exist in traditional markets: the ability to verify what is really happening instead of trusting what you are told. The tools above each solve a different part of the puzzle.
Use DEXScreener to see the market, GMGN to follow active wallets, and Dune to build custom analysis. But when the question is who actually controls a token, start with Bubblemaps. Seeing wallet clusters and true holder distribution in one visual map is the fastest way to separate solid projects from risky ones.